
2014, BERLIN
An application that allows us to retrace and understand digital photography and elementary phenomena coming along with its use.
After experiments on visualizing the great amounts of data in digital photography, I tried to lay out correlations and make them understandable. The RGB-systeme is modeled after the human physiological mixture of color and an additive color model. That means, „more color“ gets the image brighter: thus a plain white image consists of Red = 255, Green= 255 and Blue= 255. Darker pixels have lower color values.
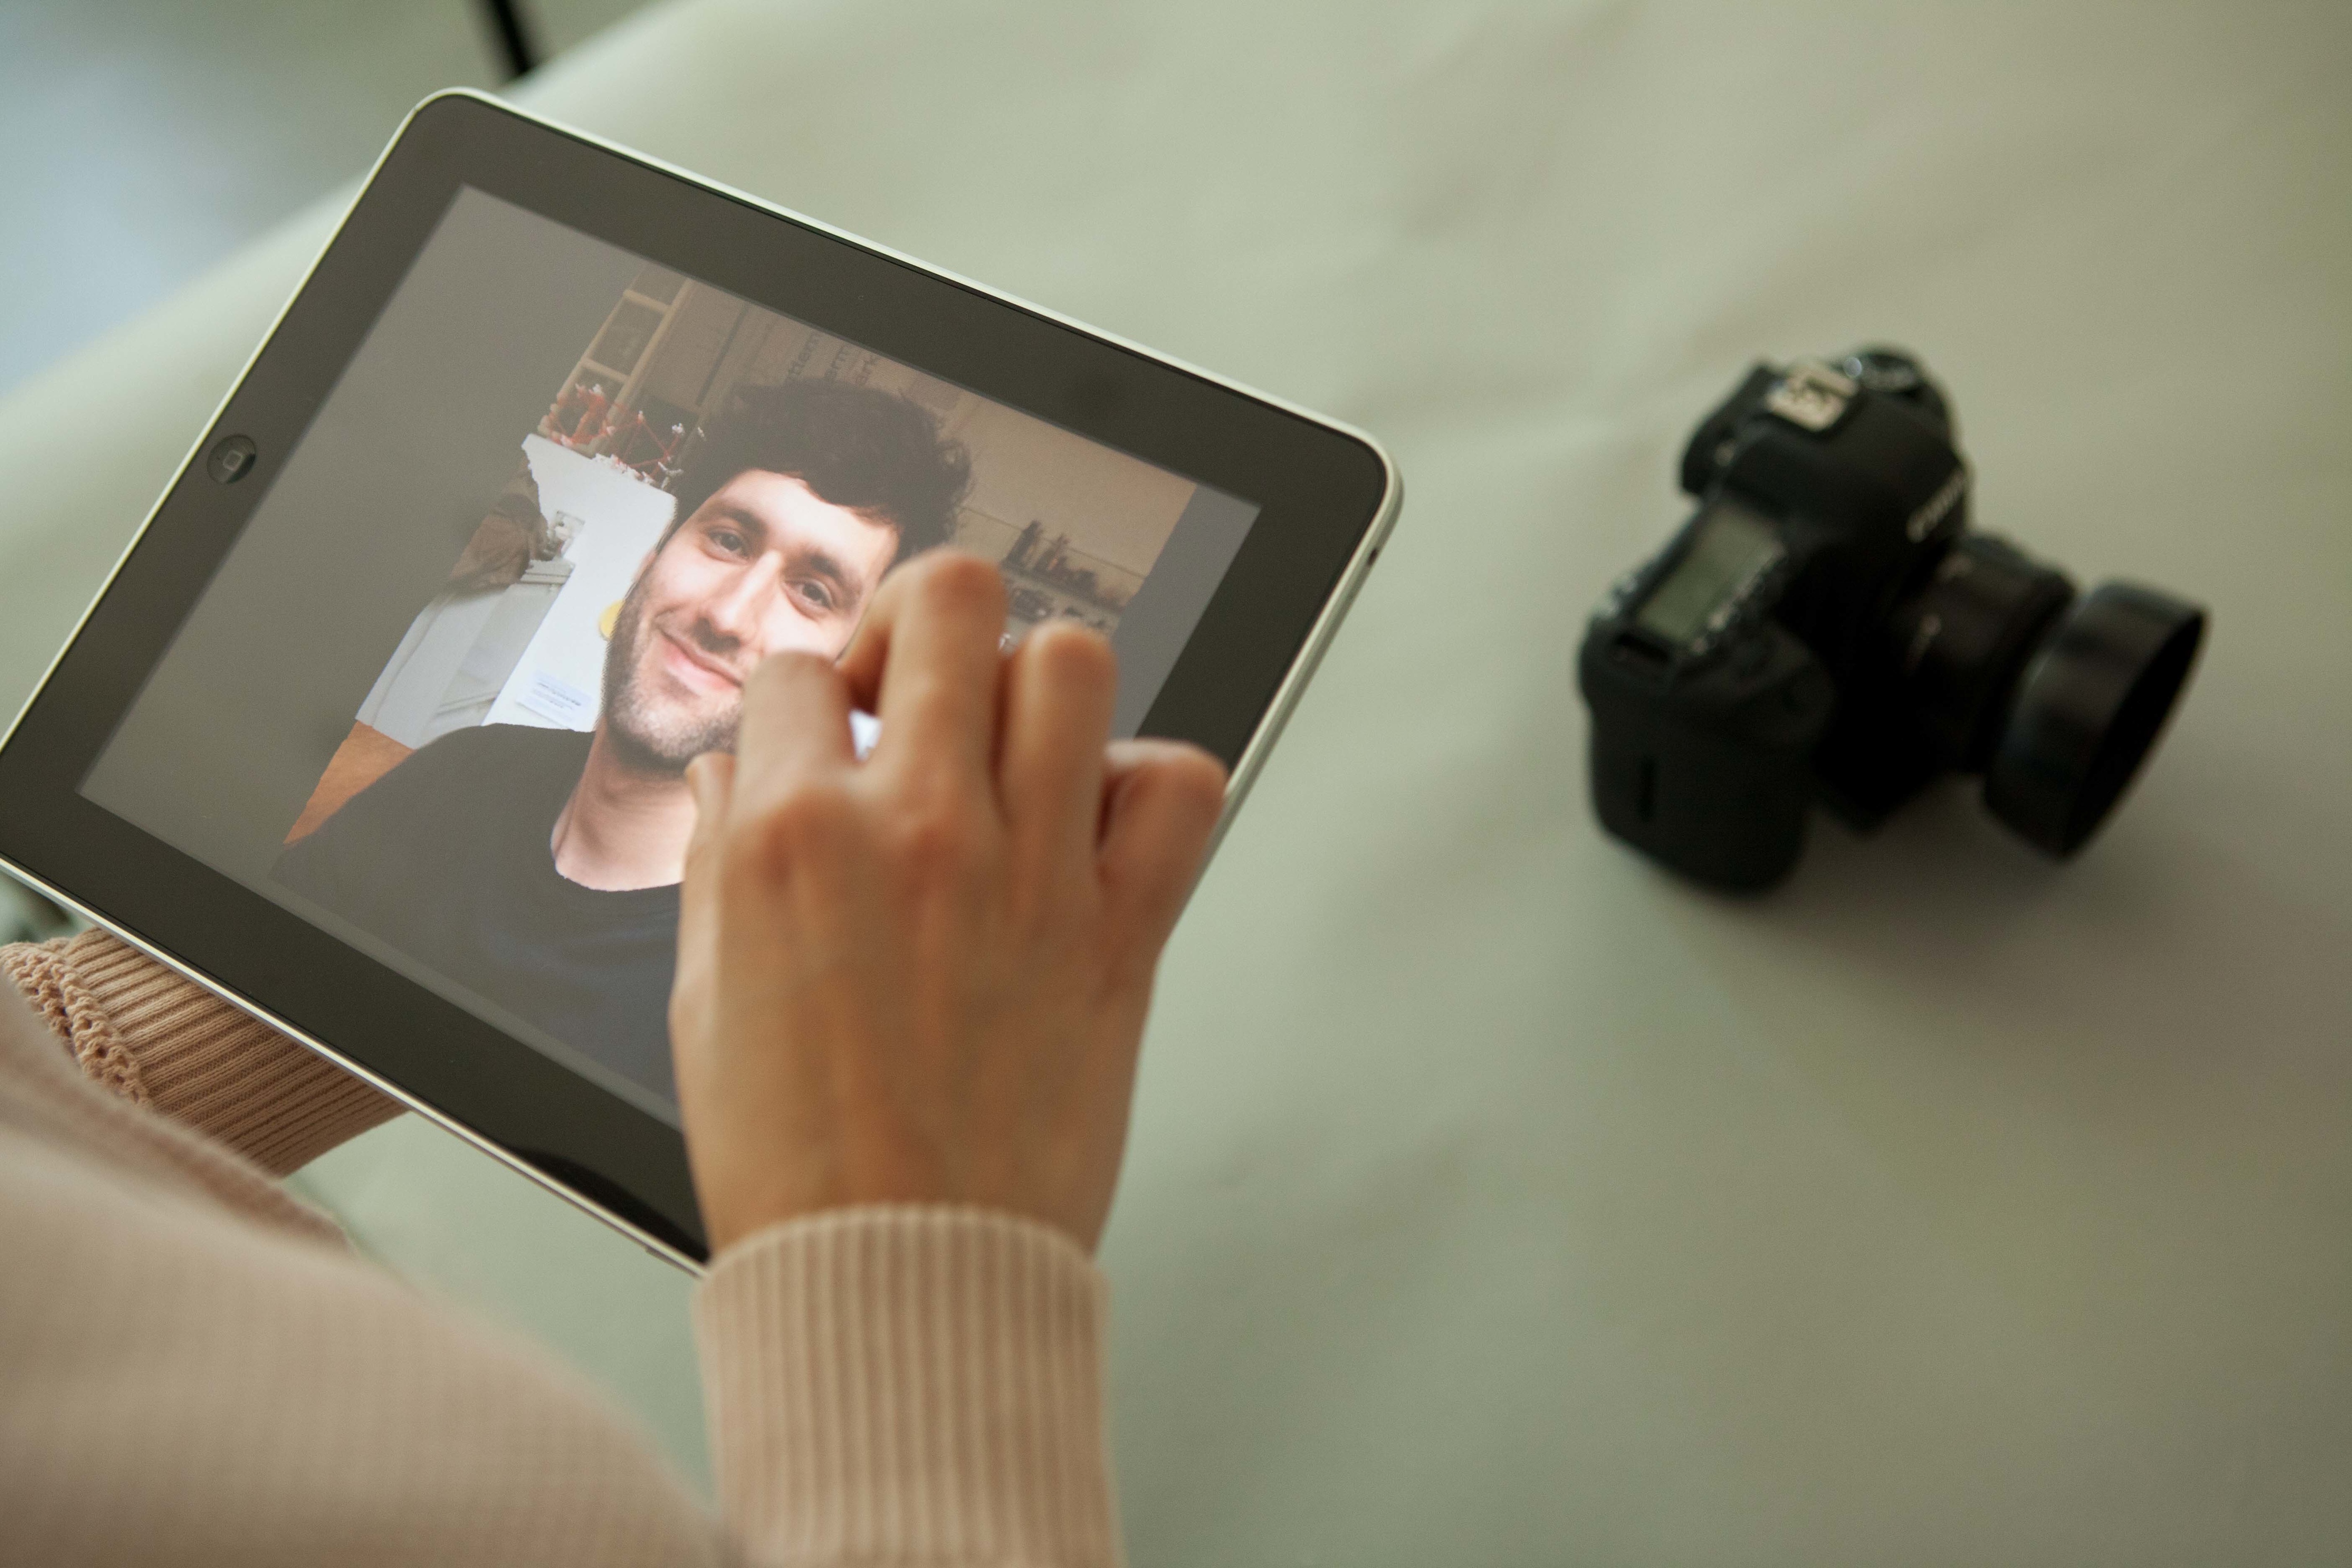

Through a simple interaction with the interface we can move the image from frontal into a side-face which visualizes the composition of each pixel. We simultaneously receive feedback how working on our image‘s brightness, hue or saturation affects the formation of each pixel. Vice versa we can let the bars grow and shrink by gestures for editing on the trackpad or tablet.